
Methodology
A two-layered analysis aimed at one thing: precision.
The New York City Department of Education does not publish scoring rubrics, question-design guidelines, or difficulty specifications for the SHSAT or Hunter entrance exams. Every test-prep provider is, to some degree, working from incomplete information.
This platform takes a different approach. Rather than relying on intuition or anecdotal teaching experience, I built two distinct analytical layers — one facing the exam itself, the other facing the student — using methods drawn from statistics, machine learning, and natural language processing. The result is a preparatory and analytic system where every question, every distractor, and every diagnostic metric is grounded in data.
My name is Eldar Sarajlic. I hold a Ph.D. in philosophy and serve as an Associate Professor at the City University of New York. My academic work focuses on reasoning, judgment, and education. This platform is the applied extension of that research — fully human-designed, not AI-generated.
01 — Front-end analytics: examining the test
Before any student sits down, the exam itself is the first subject of study.
I collected eight years of DOE-released sample tests — over a thousand pages of material comprising 1,368 questions and more than 5,000 individual answer choices. This corpus was then subjected to systematic analysis: Flesch-Kincaid readability scoring across all reading passages, NLP-based classification of every question by cognitive task, a distractor taxonomy that categorizes each wrong answer by the type of reasoning error it is designed to exploit, and statistical distribution mapping of skills, topics, and difficulty levels across test years.
The objective is to reverse-engineer what these exams actually measure — not what they claim to measure, but what the data reveals about their construction. The sections below present some of the key findings. I will publish more detailed analyses in the Research section of this site.
02 — Reading complexity
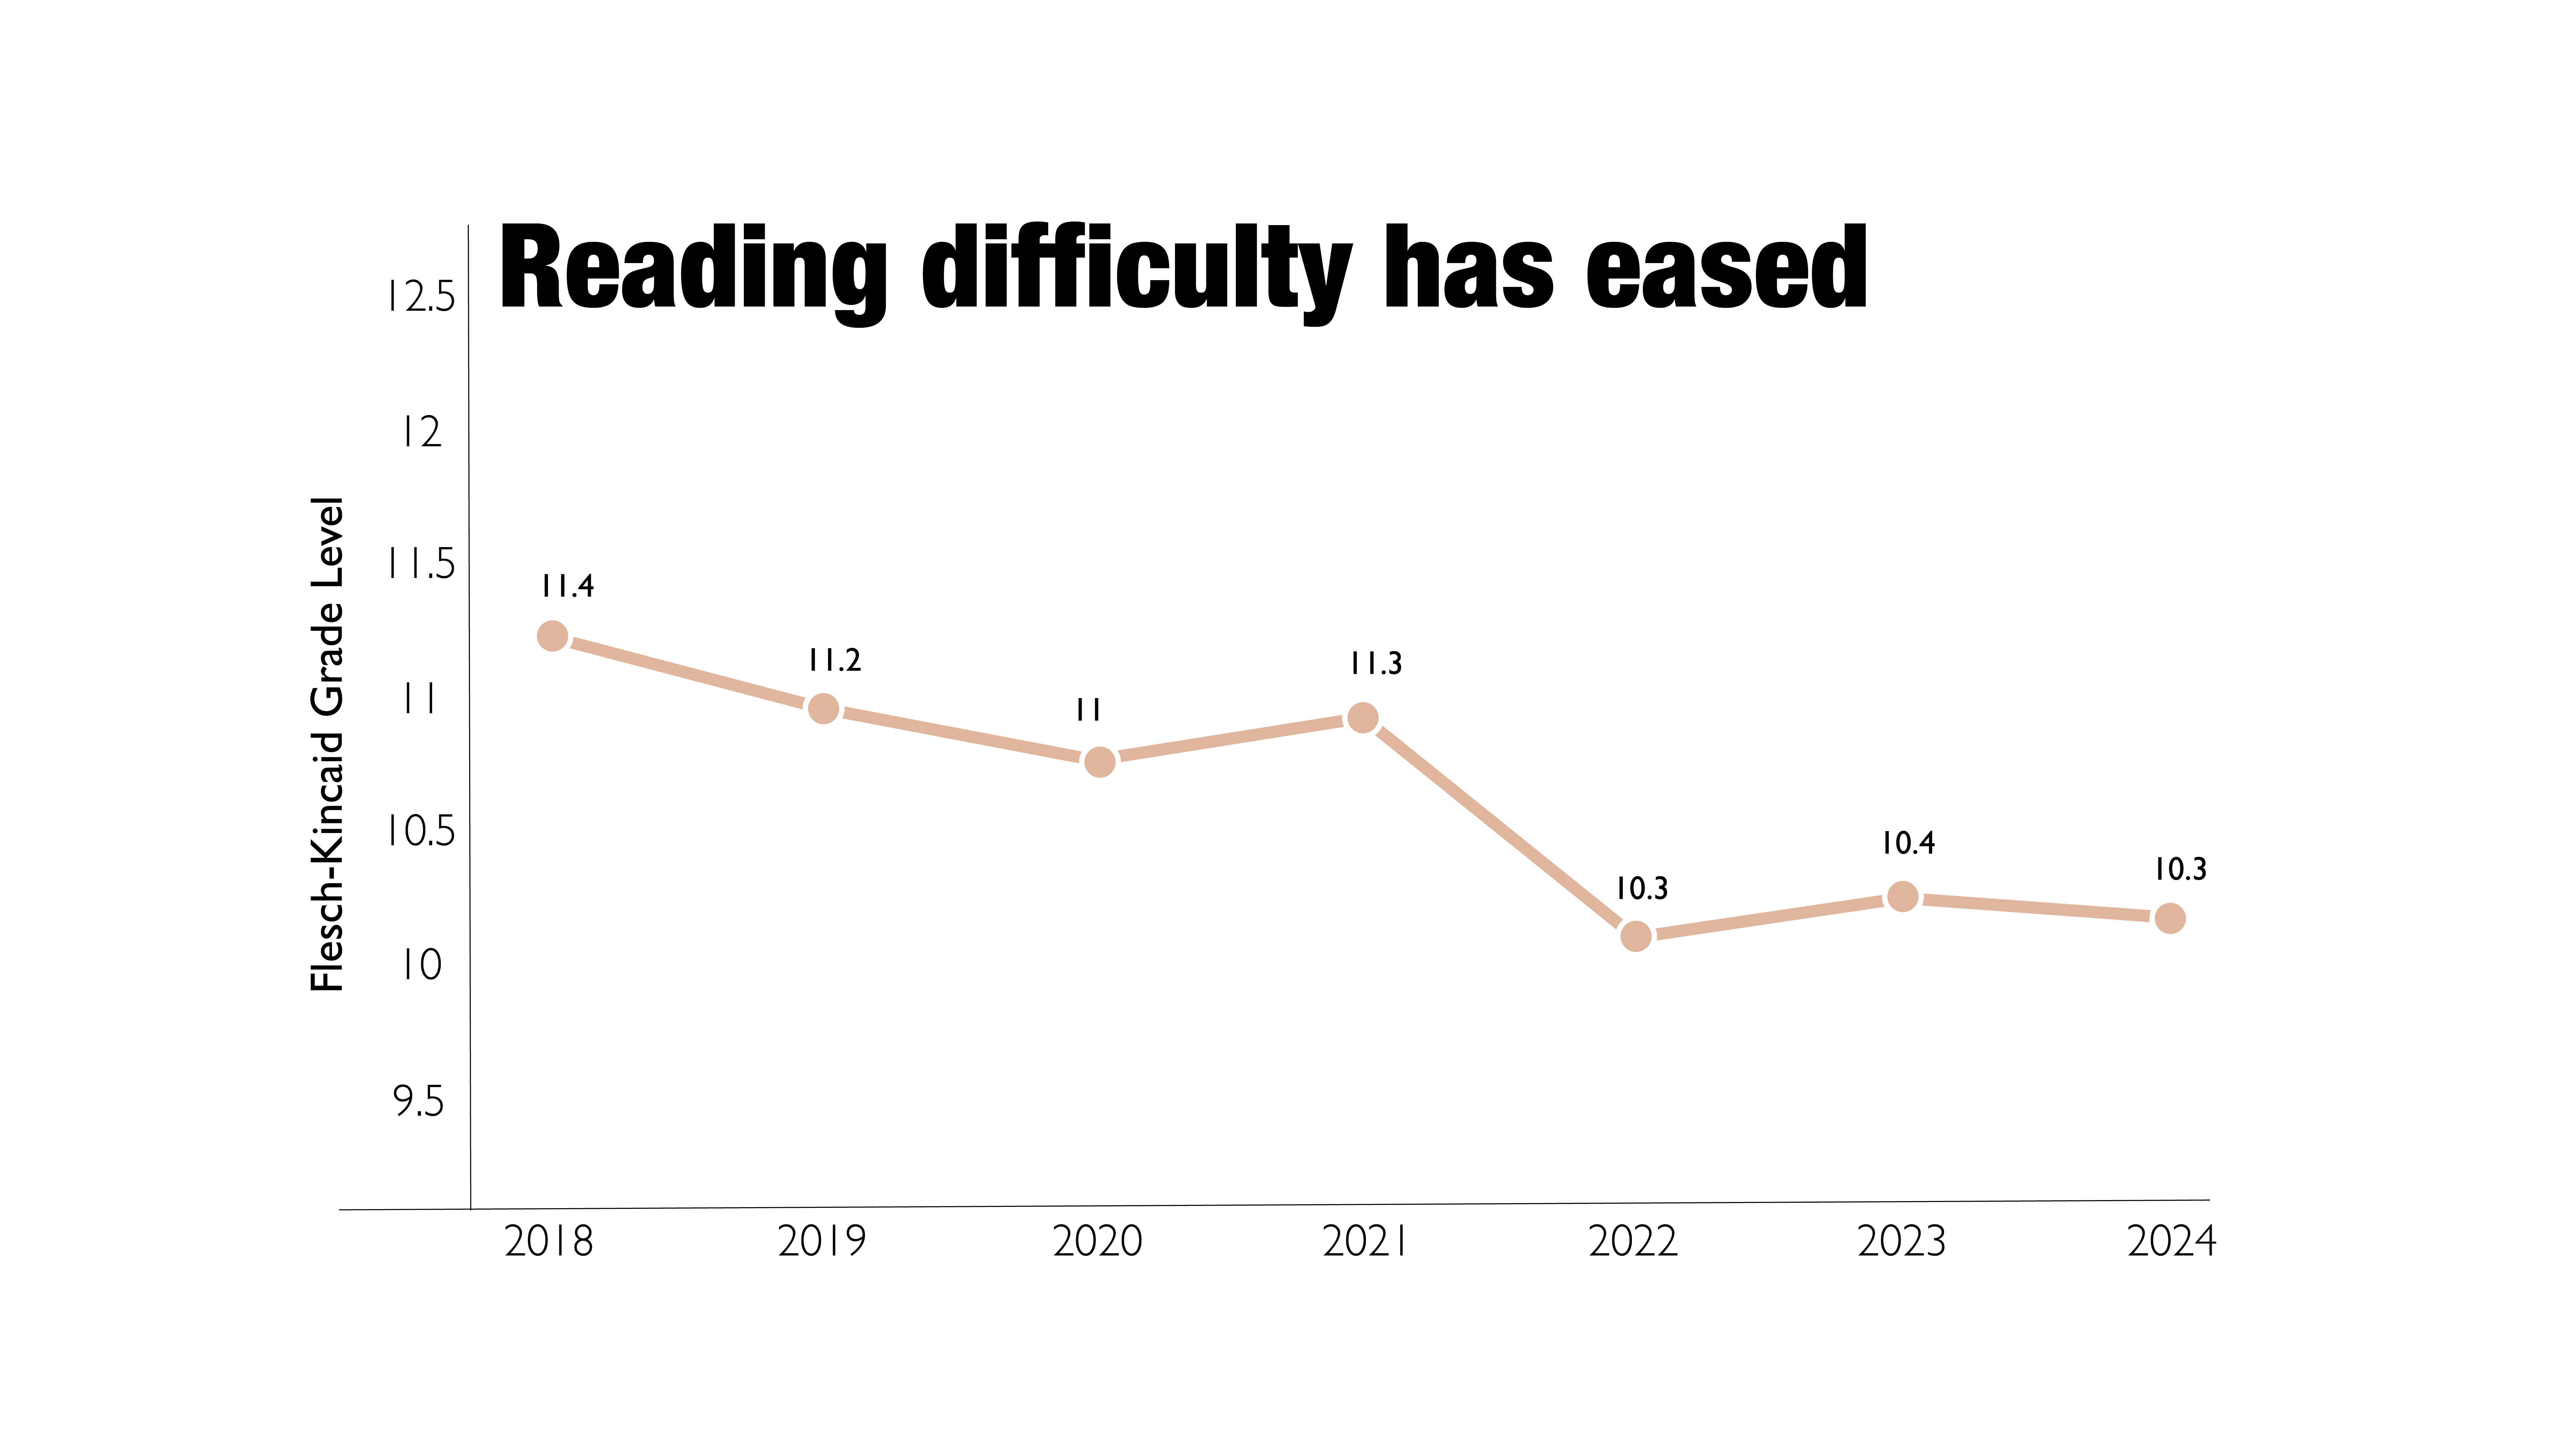
SHSAT passages read at an 11th-grade level.
Flesch-Kincaid Grade Level analysis across all released reading passages shows that eighth-grade test-takers are expected to process text written three grades above their level. Several passages register at genuine college-level difficulty.
03 — Question classification
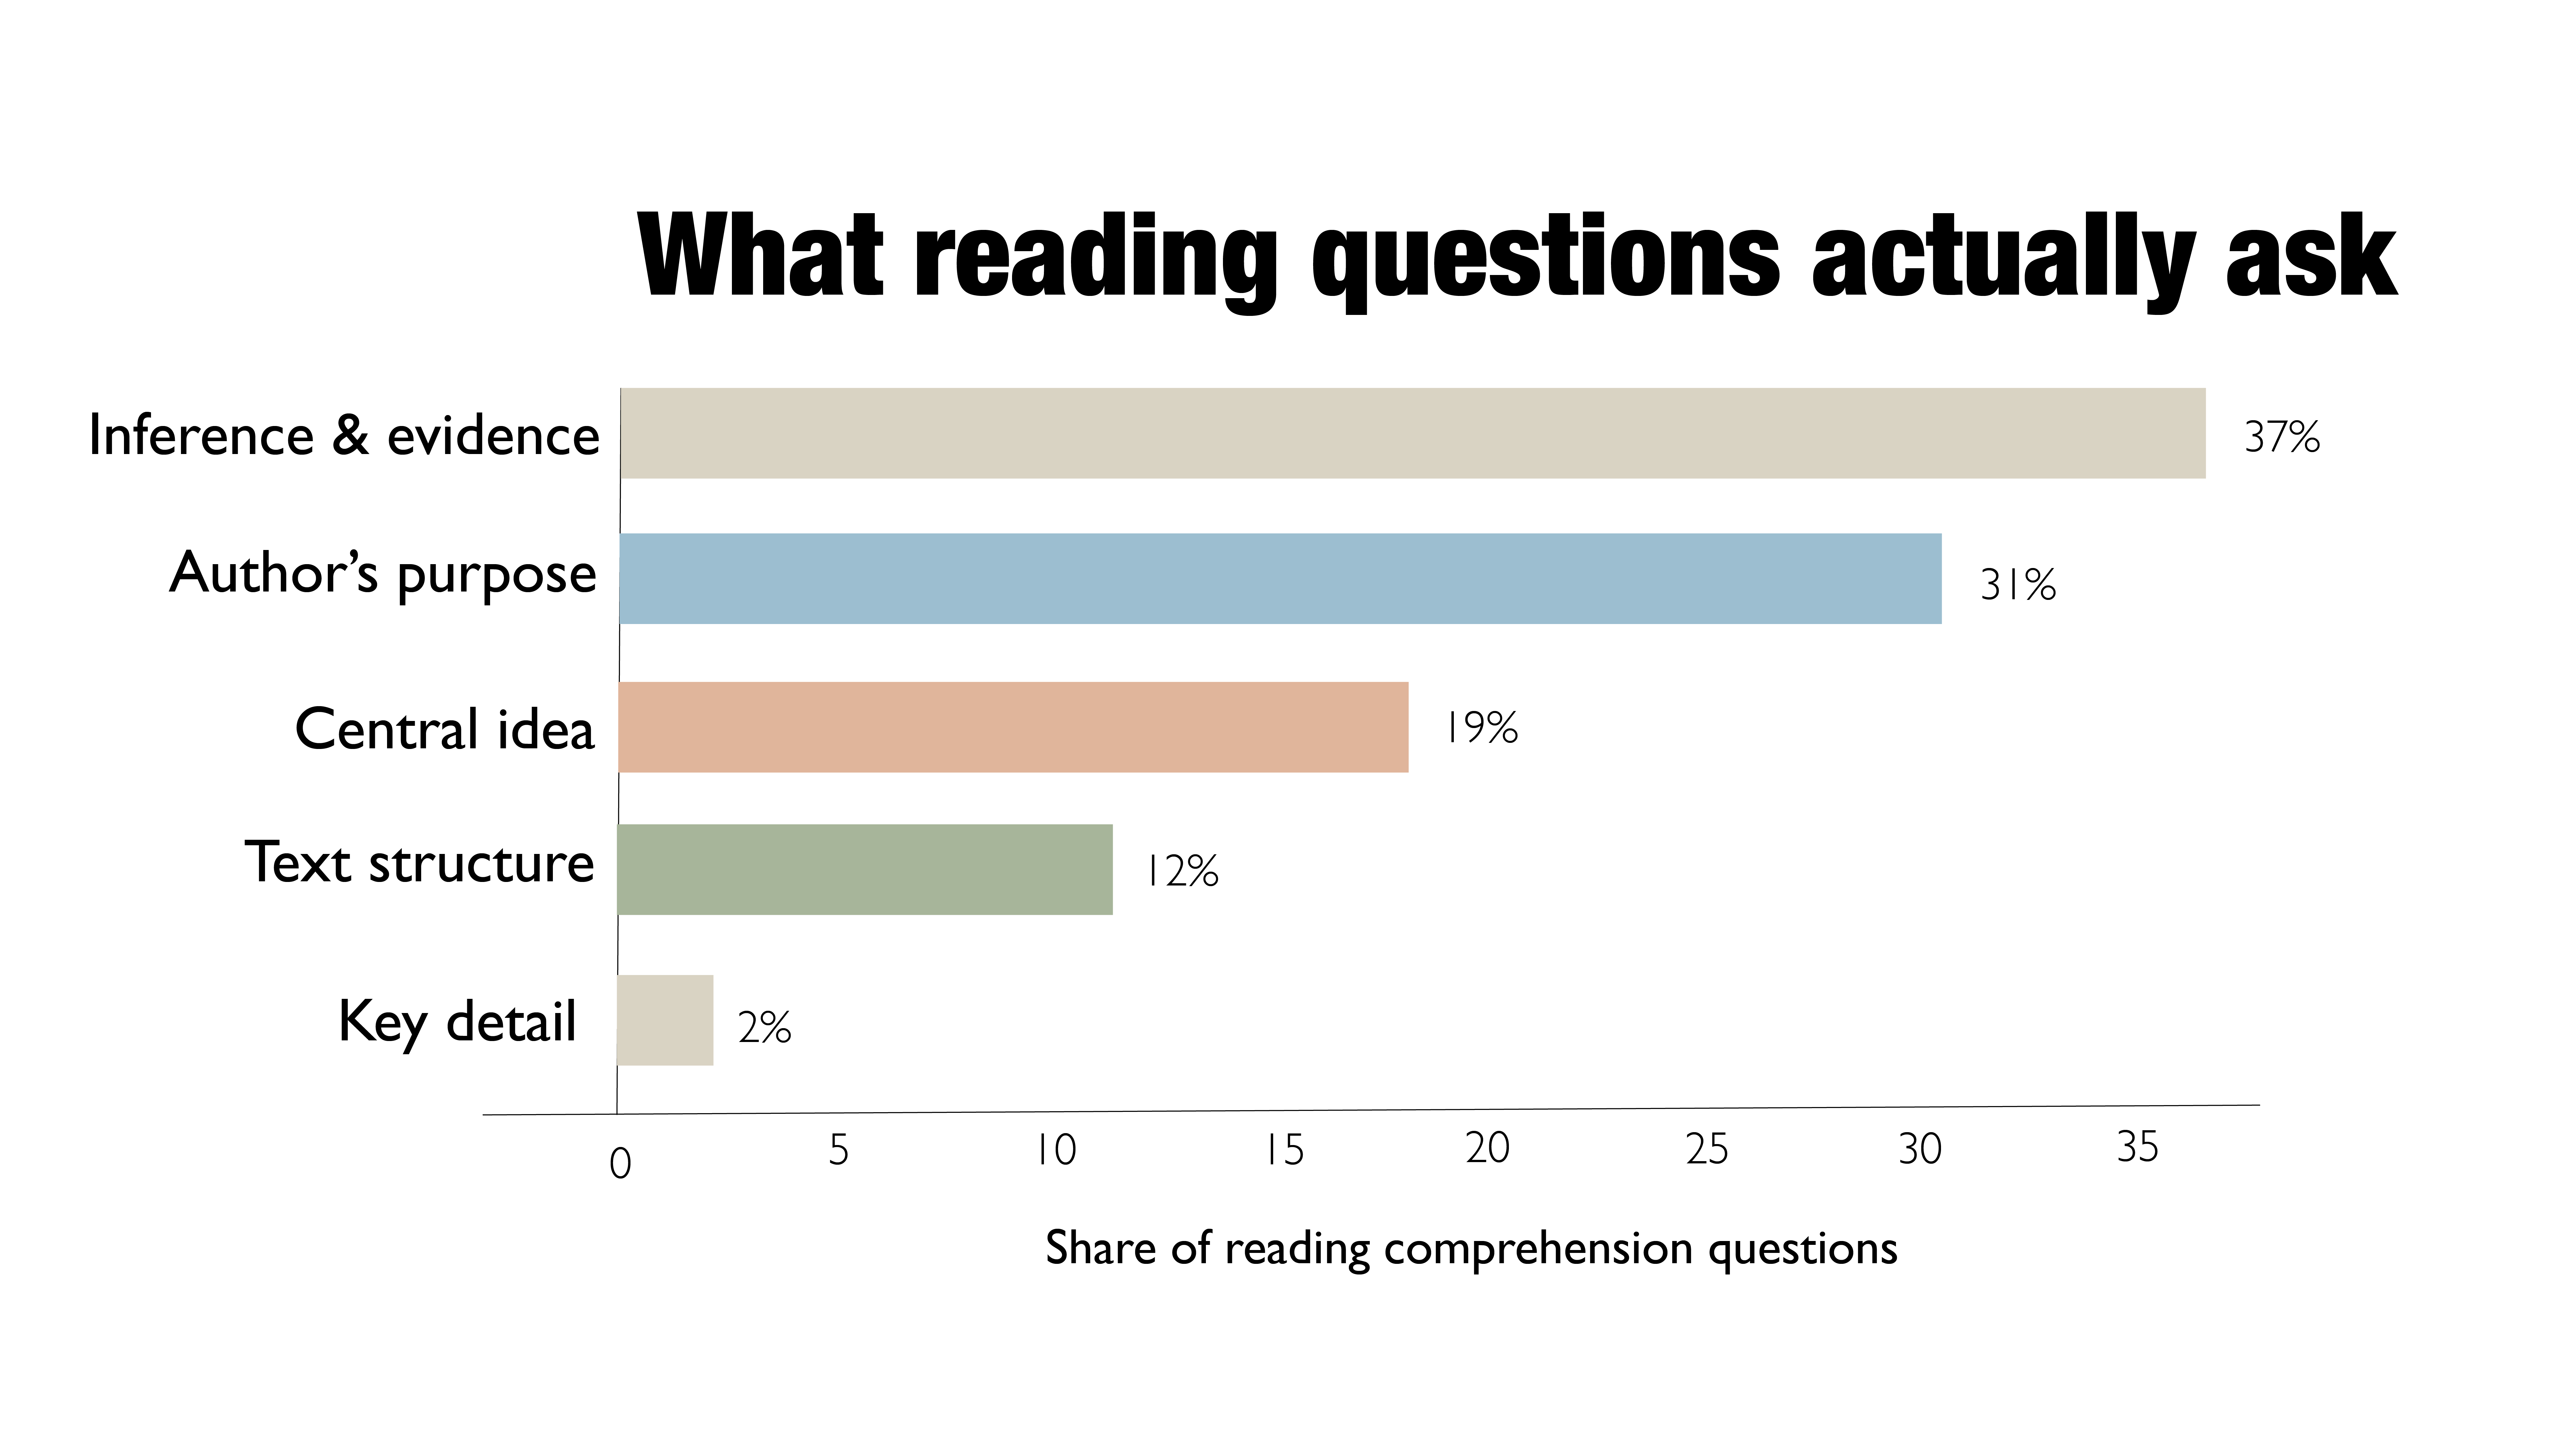
More than a third of questions require the reader to draw an inference.
Every reading comprehension question was classified by the cognitive task it demands. Interpretation and inference dominate the distribution. Nearly a third of questions target the author's rhetorical or narrative choices. This classification determines where preparation time is most productively spent.
04 — Distractor taxonomy
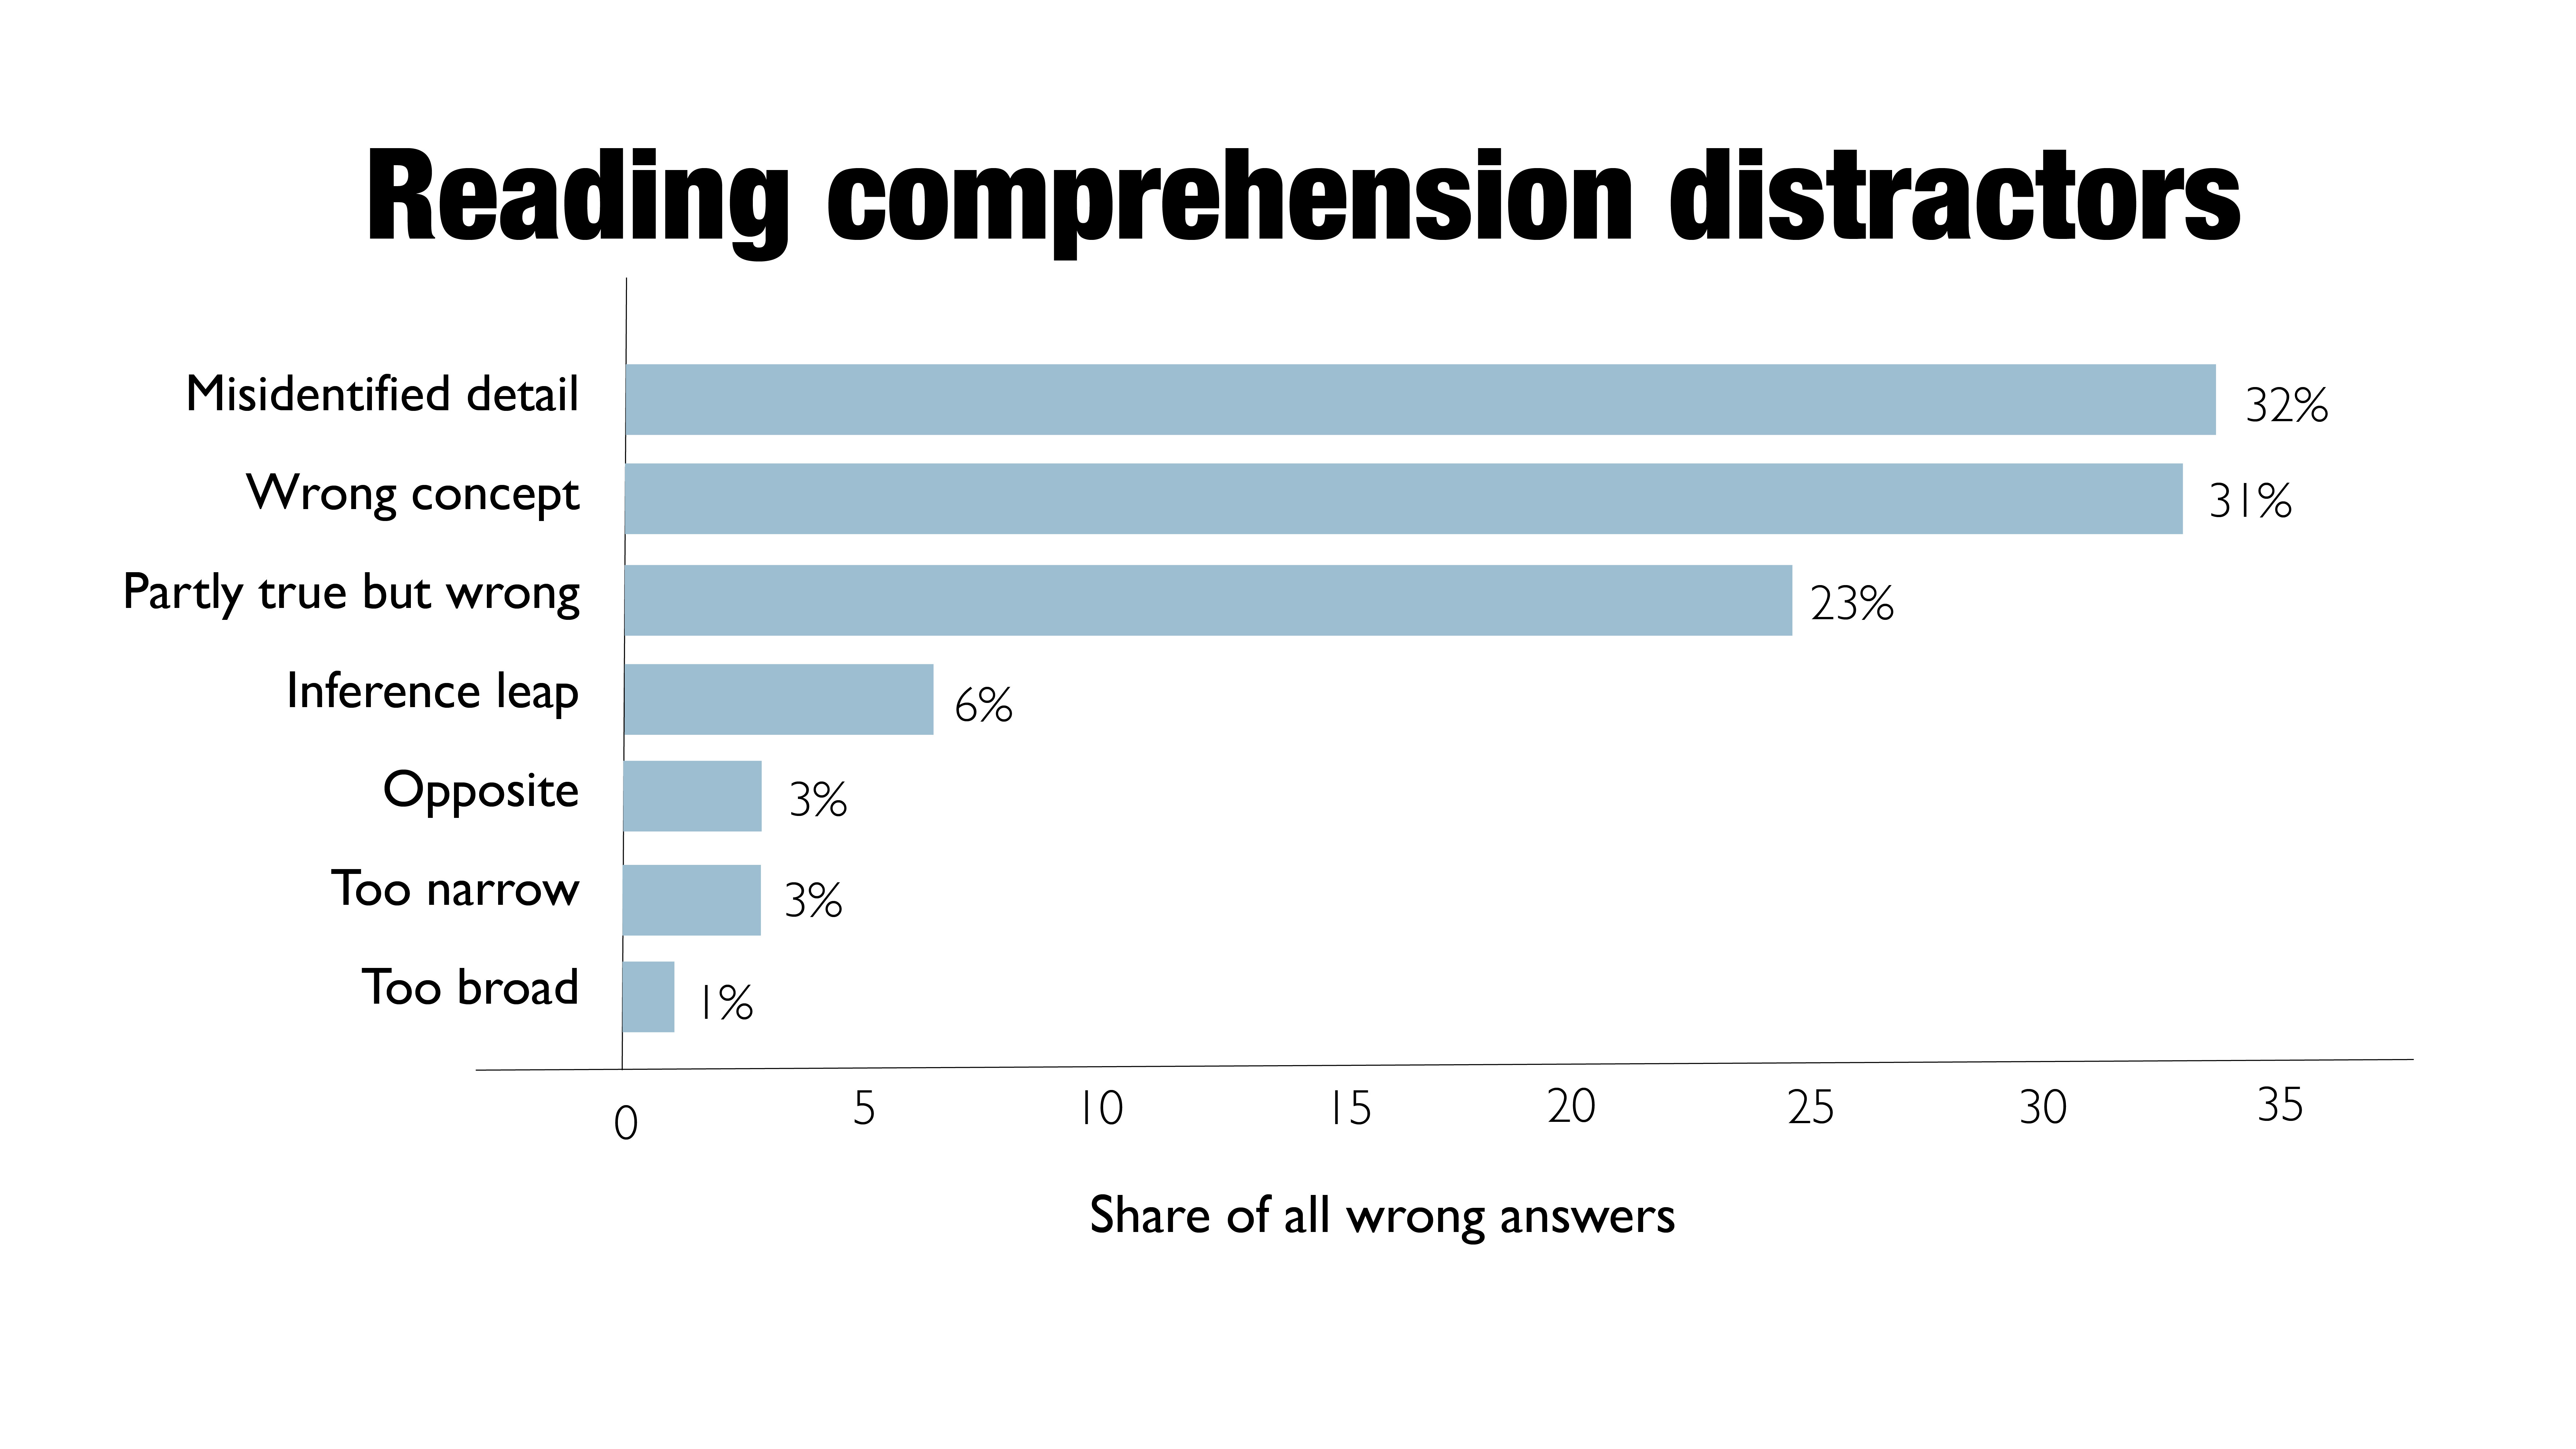
Every wrong answer is engineered to exploit a specific reasoning error.
I analyzed every incorrect answer choice in the ELA reading comprehension sections and classified them into 28 distinct trap types. A misidentified-detail trap points to something genuinely present in the passage, but not what the question asks about. A wrong-concept trap sounds plausible but rests on a misunderstanding of the text. The partly-true-but-wrong trap is the most effective: partially accurate, which is precisely what makes it attractive under time pressure.
05 — Math distribution and traps
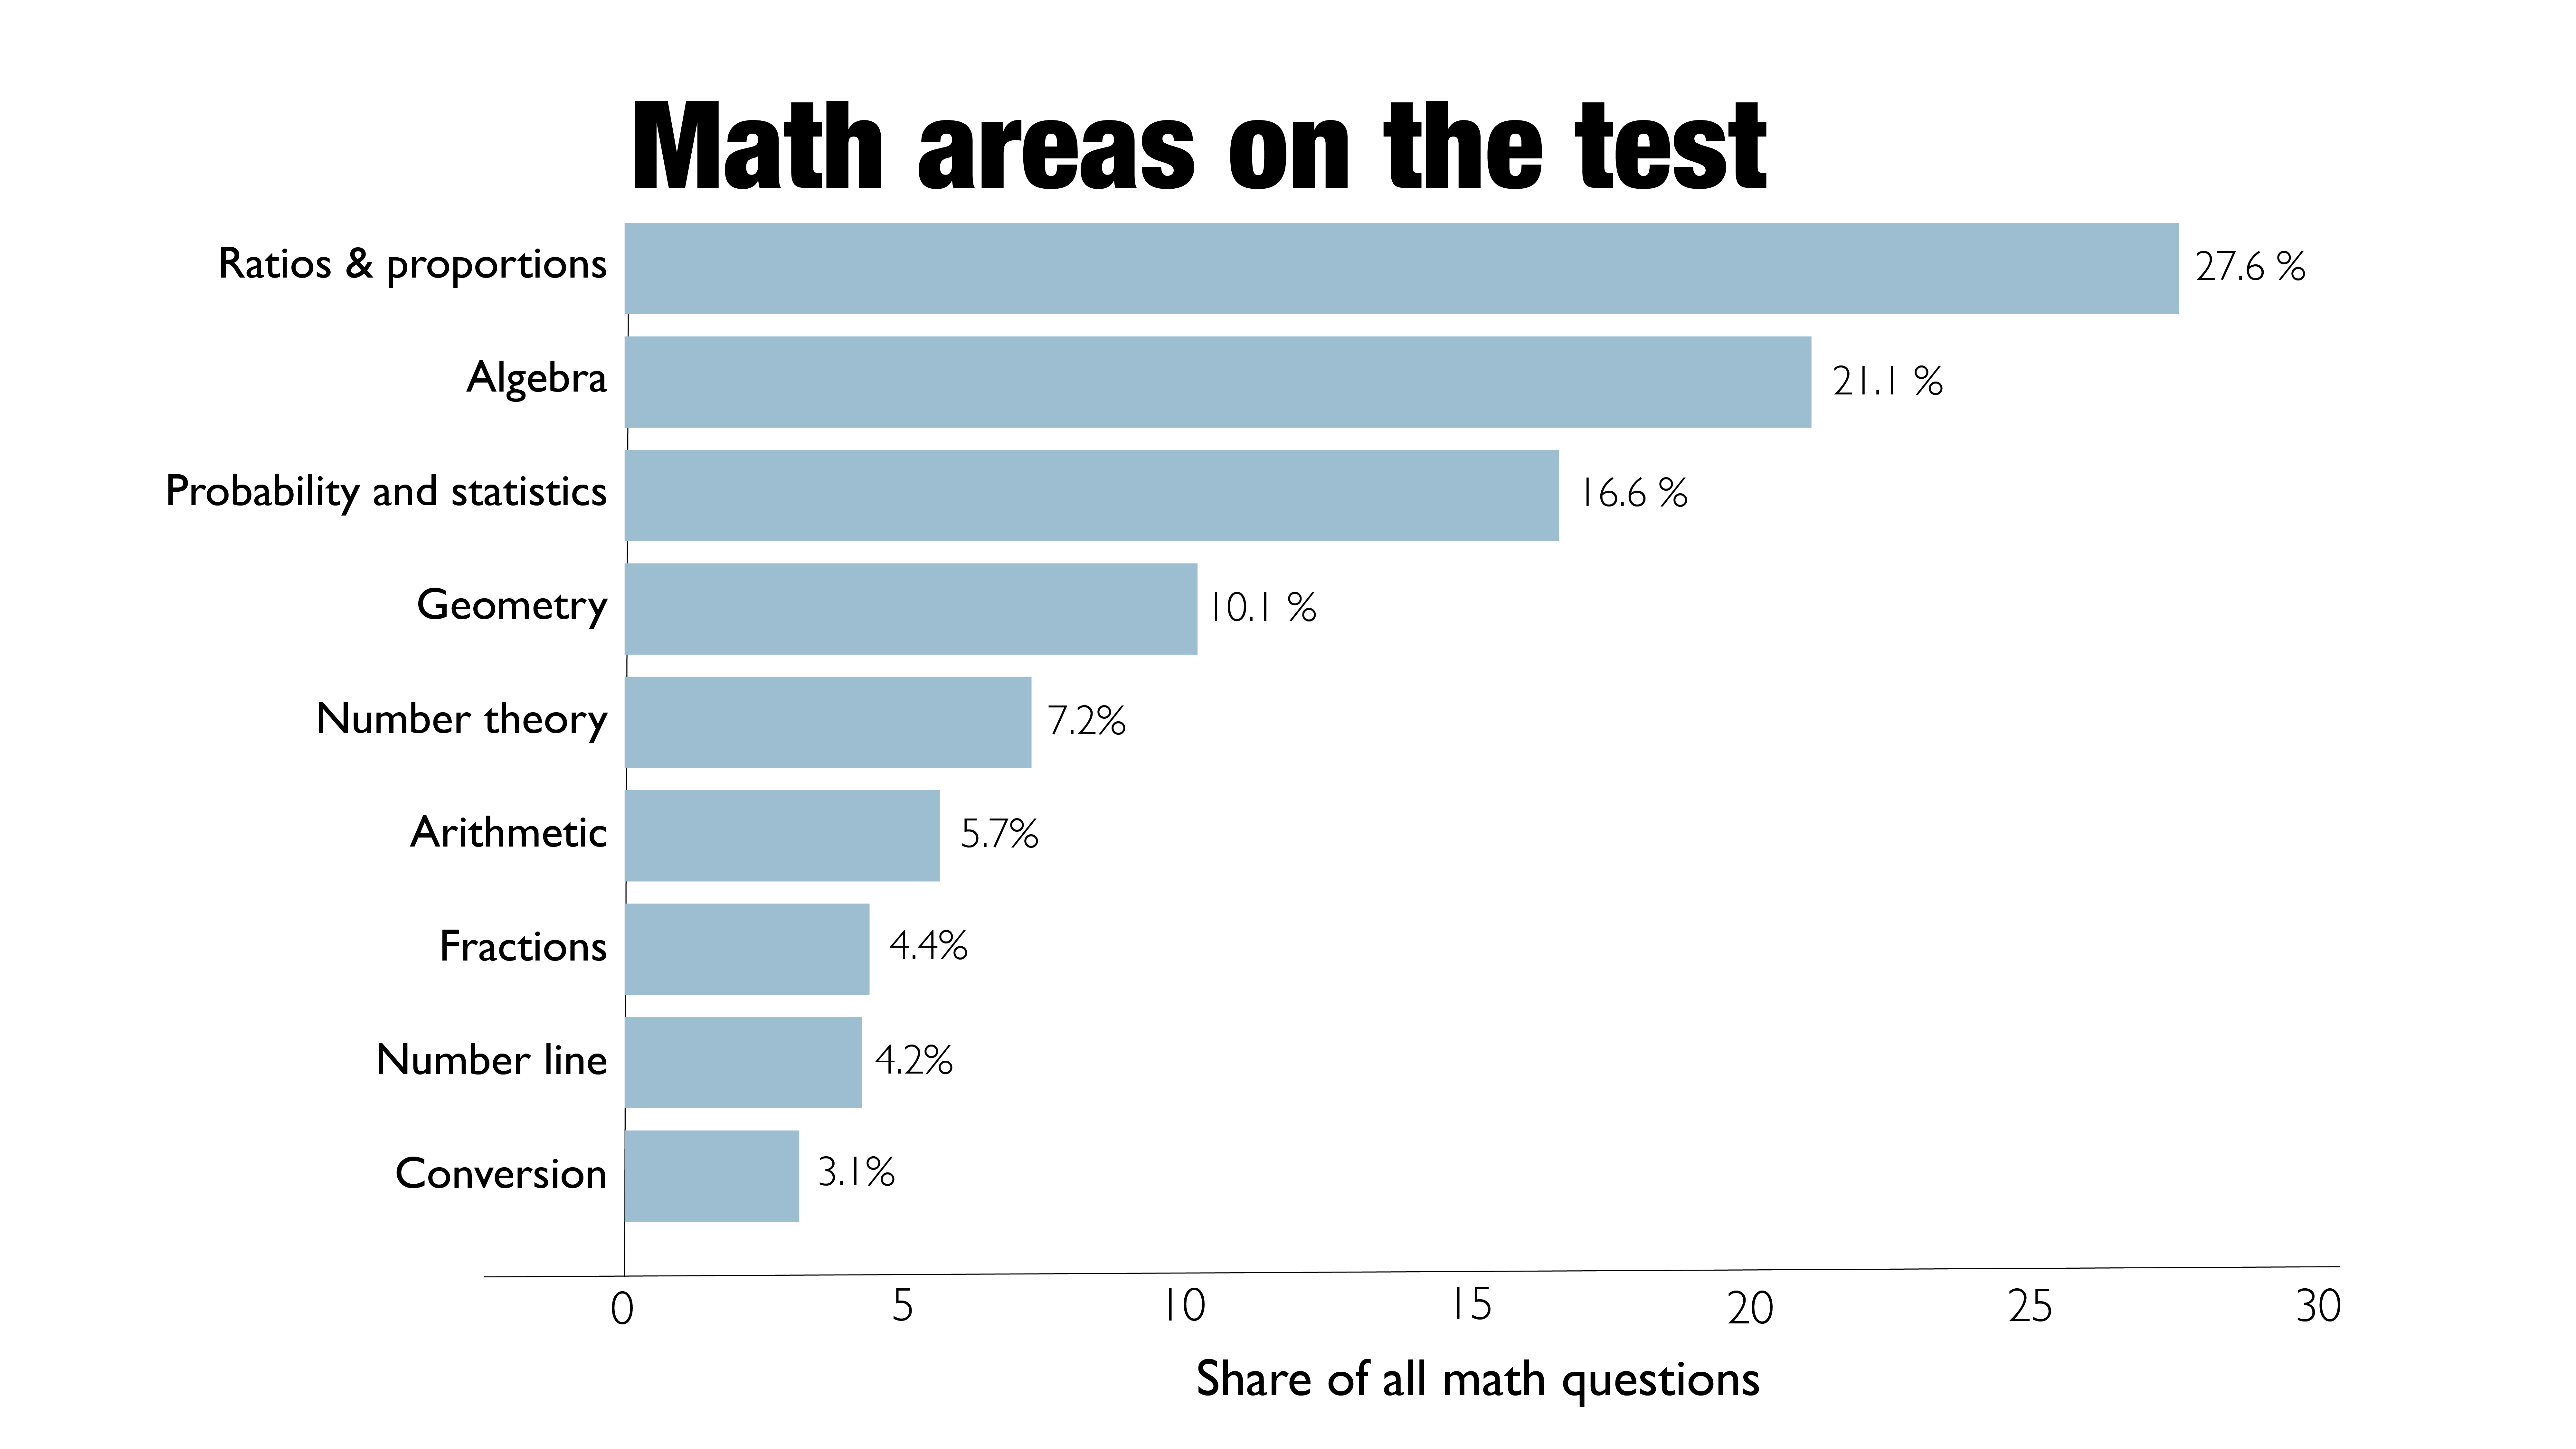
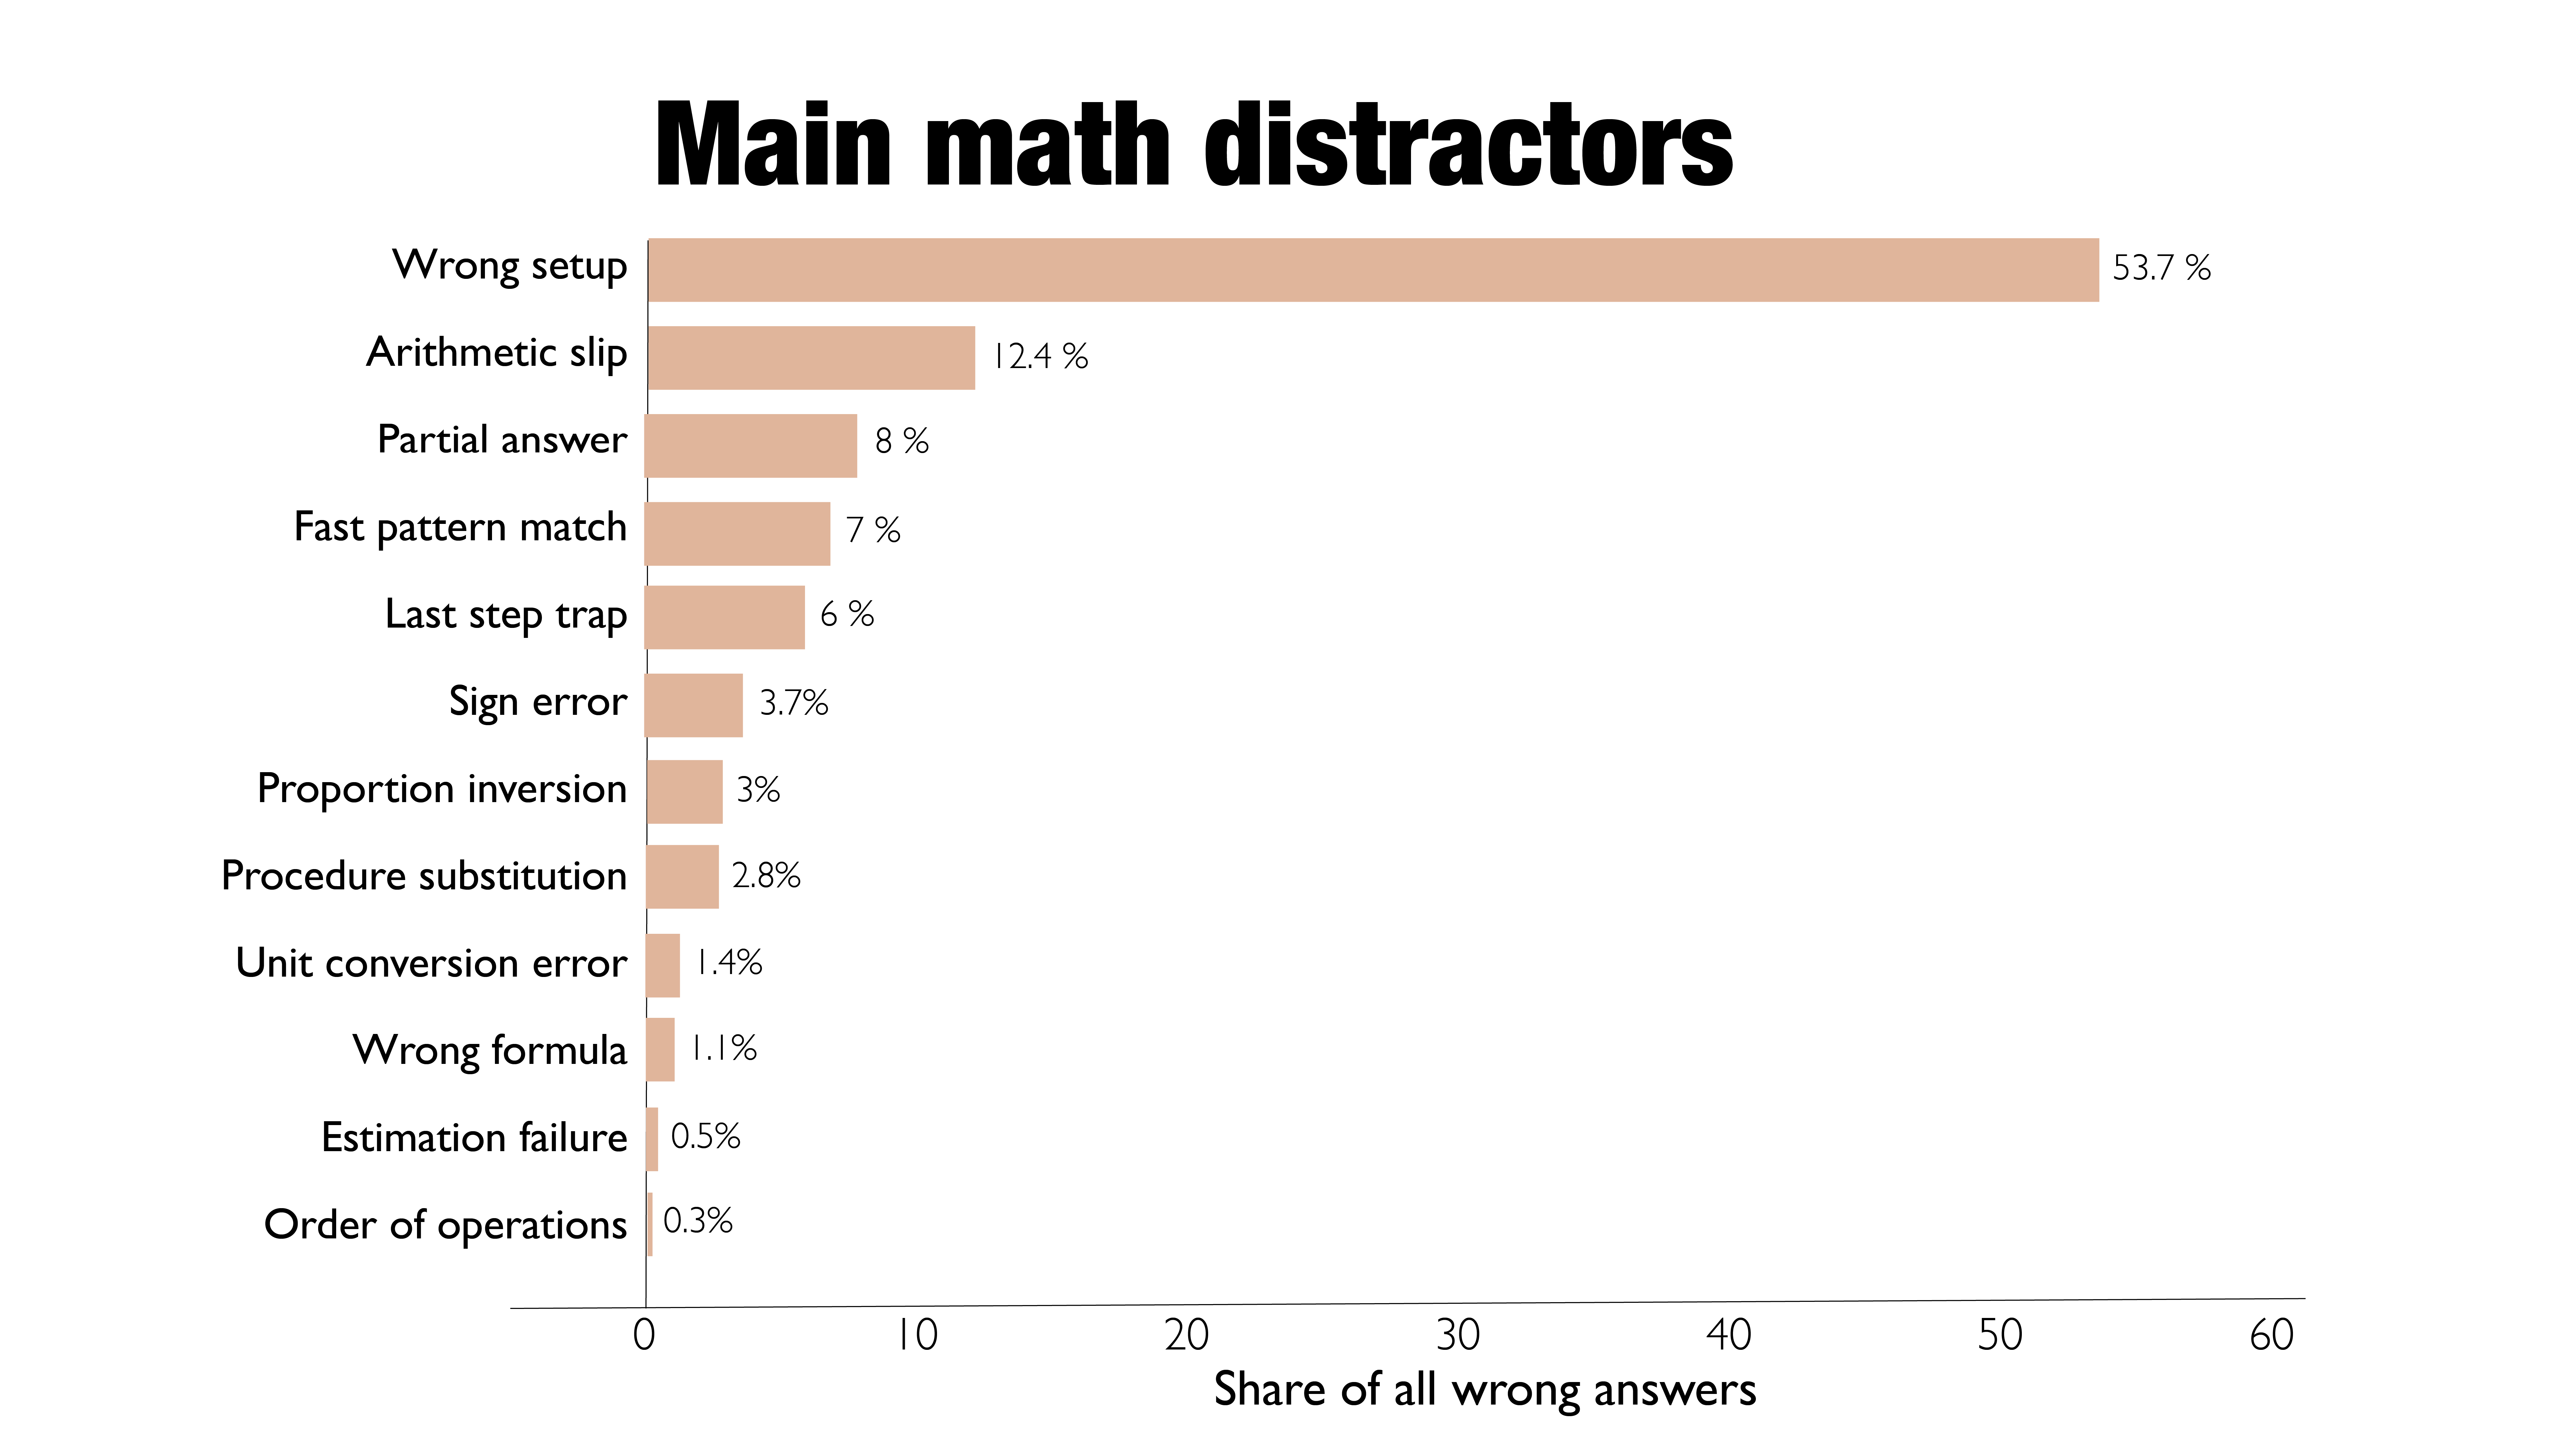
Ratios, proportions, and algebra dominate. The traps target the setup.
Statistical mapping of the math section reveals ratios/proportions and algebra as the most frequently tested skills. More than half of all math distractors present answer choices derived from an incorrect problem setup. The remainder exploit predictable errors: arithmetic slips, premature answers, or a dropped sign.
06 — Back-end analytics: diagnosing the student
After the test, a second layer of analysis begins.
The front-end analytics describe what the exam does. The back-end analytics describe what the student does. After each practice test, an automated pipeline processes every response: which trap types caught the student, accuracy broken down by skill area and difficulty level, time-per-question analysis, and percentile placement against actual DOE cutoff scores for each specialized high school.
Across multiple attempts, machine-learning-assisted pattern detection identifies which error types persist and which don't — distinguishing between gaps in knowledge and gaps in reasoning. This is the diagnostic engine that powers the dashboards and drives targeted preparation. Both parents and tutors can use that to make their teaching and prep more effective.
07 — Philosophy of education
My goal is not to teach tricks, but reasoning.
Standardized test performance is, at its core, a measure of critical thinking under constraint. The analytics on this platform exist to identify precisely where a student's reasoning breaks down — not merely where an answer is wrong. A wrong answer caused by misreading a question, by falling for a plausible distractor, or by rushing past a key detail represents three entirely different failures, each requiring a different intervention. Good tutors know this well.
This distinction — between wrong answers and the reasoning behind them — is the philosophical foundation of everything built here.
08 — What this produces
Practice tests calibrated to the real distribution.
The front-end analysis produced Baseline and Benchmark tests that replicate, as closely as the data permits, the actual distribution of reading complexity, question types, skill areas, and distractor strategies used by the DOE. Every question is carefully crafted and double-checked by a human, not AI. Every wrong answer is tagged by trap type. Every explanation is structured by a person.
The back-end analysis turns each completed test into a detailed diagnostic: which trap types caught your child and how often, how accuracy varies by skill area, which mistake patterns persist across tests, and where your child places against real admissions cutoffs.
Ready to try it?
Start with the free Baseline Test. Full error analysis, no credit card.
See available tests